+ Reply to Thread
Results 1 to 5 of 5

Thread: Greg

  1. #1
    Administrator
    Join Date
    May 2010
    Posts
    149

    Greg

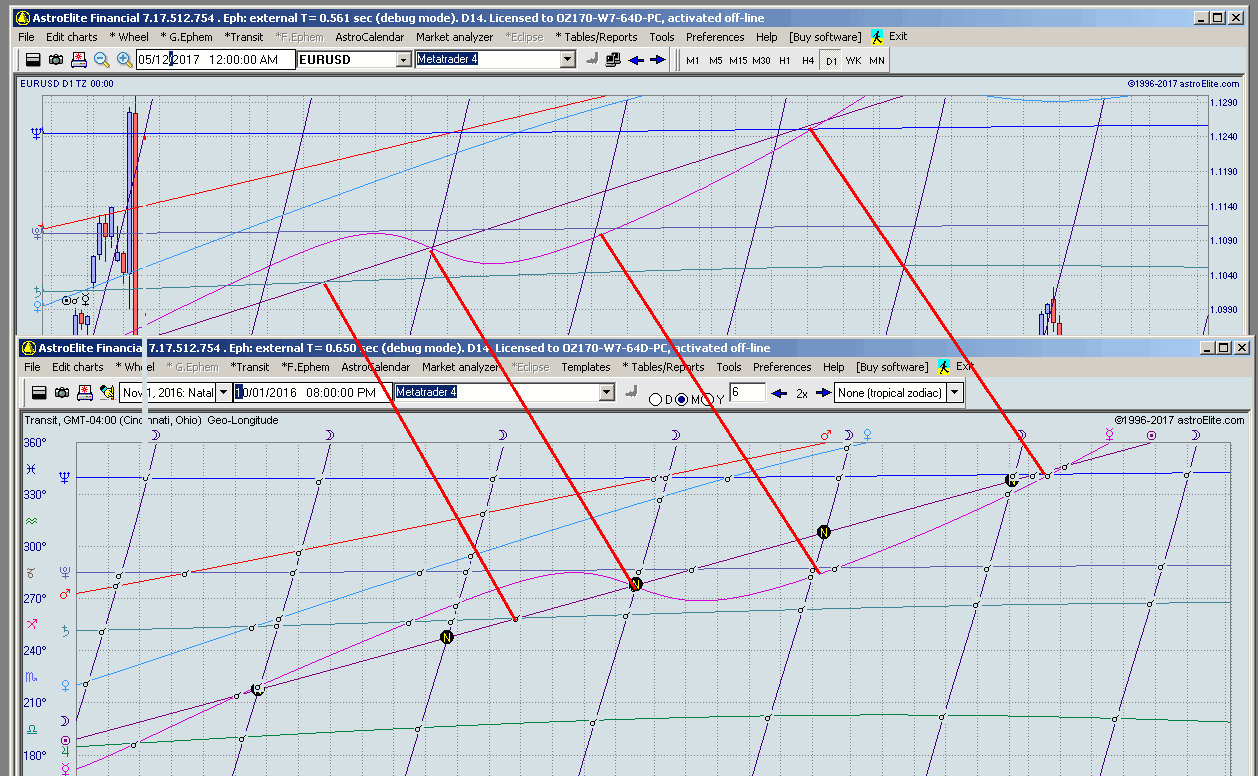
    When i look at a chart in the G.Ephem vs the E.Phem the charts look the same but the transit lines don't.Shouldn't these match?
    There may be a slight difference in appearance because in FE the days when market is closed simply elapse, but a big difference means different settings like GE harmonic value that is always 1 in FE. At whole, the planetary patterns must match.


    Is there a way to "zoomout" in the F.Ephem to see the upcoming aspects and transit paths?
    Use Prefs->Fin.Ephem->Chart shift option to see the aspects for future bars.


    In many cases AstroCalendar is more convenient for that purpose.

  2. #2
    Administrator
    Join Date
    May 2010
    Posts
    149
    Quote Originally Posted by Greg
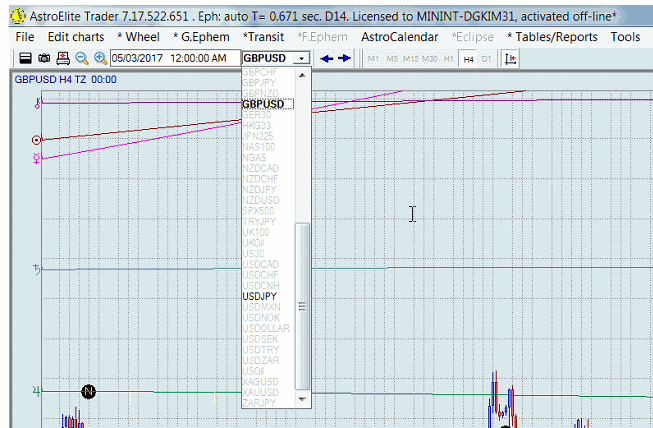
    The D1 button is grayed out.. i can't change anything in that area.
    the financial instruments pull down is grayed out..
    The program checks data files availability and disables selection of those are missing.
    On your screenshot we may see that GBPUSD and USDJPY as well as H4 button are enabled (black).
    That means that you have at least once looked at GBP/USD and USD/JPY four-hour charts and the files GBPUSD240.hst and USDJPY240.hst been created in data folder.


    Run Metatrader and inspect a data folder for other files availability.
    For instance, EUR/USD daily file has name EURUSD1440.hst (1440 minutes in 24 hours, one day).

    If you don't know where this folder is, read Get path to Metatrader data historical files topic.


  3. #3
    Administrator
    Join Date
    May 2010
    Posts
    149
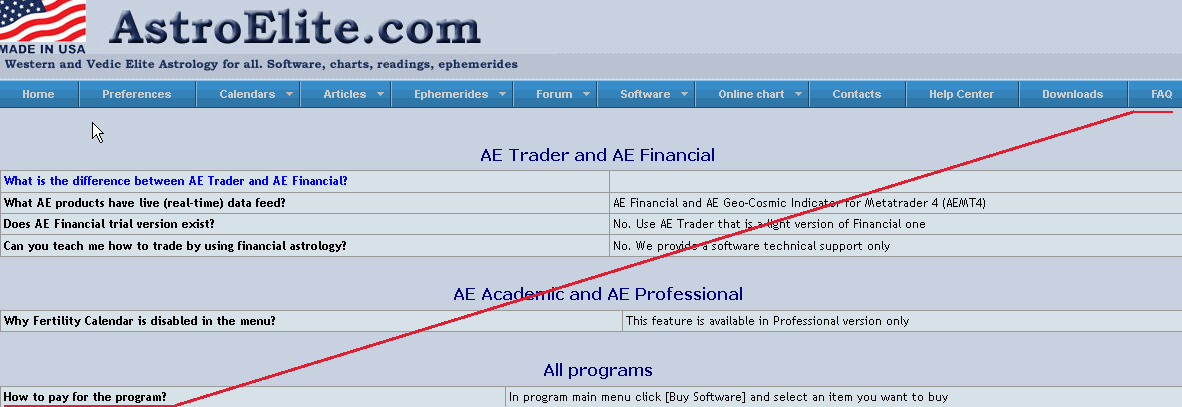
    My AE timed expired, I'd like to purchase it...How does that work?
    You might see a [Buy software] menu item every time you have run the program. Just click it.


    Also this question is answered in FAQ


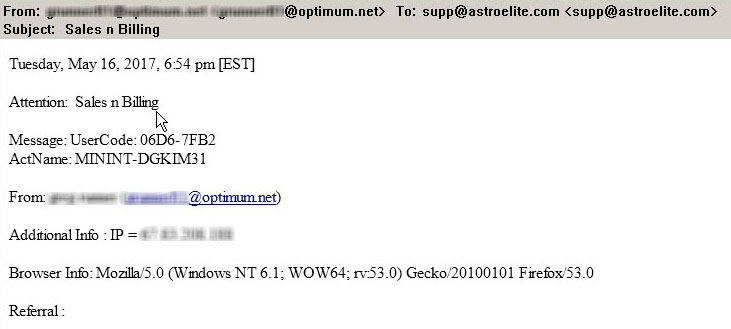
    i went to help then "request an activation key" on the 16th. and haven't gotten a reply.
    That's your request. We have no idea what it is about.


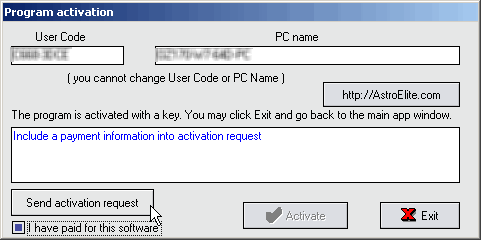
    Activation key request is intended for those customers whose program copy didn't activate automatically. It has to be sent after payment and include information about one.


  4. #4
    Administrator
    Join Date
    May 2010
    Posts
    149
    When i look at a stock chart in the F.Ephemeris and have the transit paths and/or declination paths shown they change position relative to the stock chart when you zoom in and out.
    Shouldn't the relationship between the chart and paths stay the same? is something off?
    Planetary parameters (coordinates, speed) have no quantitative relations to financial instrument price. Therefore their graph positions are independent.
    Attempts to use longitude line as support/resistance level originates from pre-computer era when it was impossible or hard to verify this hypothesis on large amount of different data.
    There is no formula to calculate price from planetary parameters.

  5. #5
    Administrator
    Join Date
    May 2010
    Posts
    149
    some of the descriptions are hard to read because they are cut off, like the resolution is off..


    Your system font size is set too big and for best results has to be in 100-125% range.

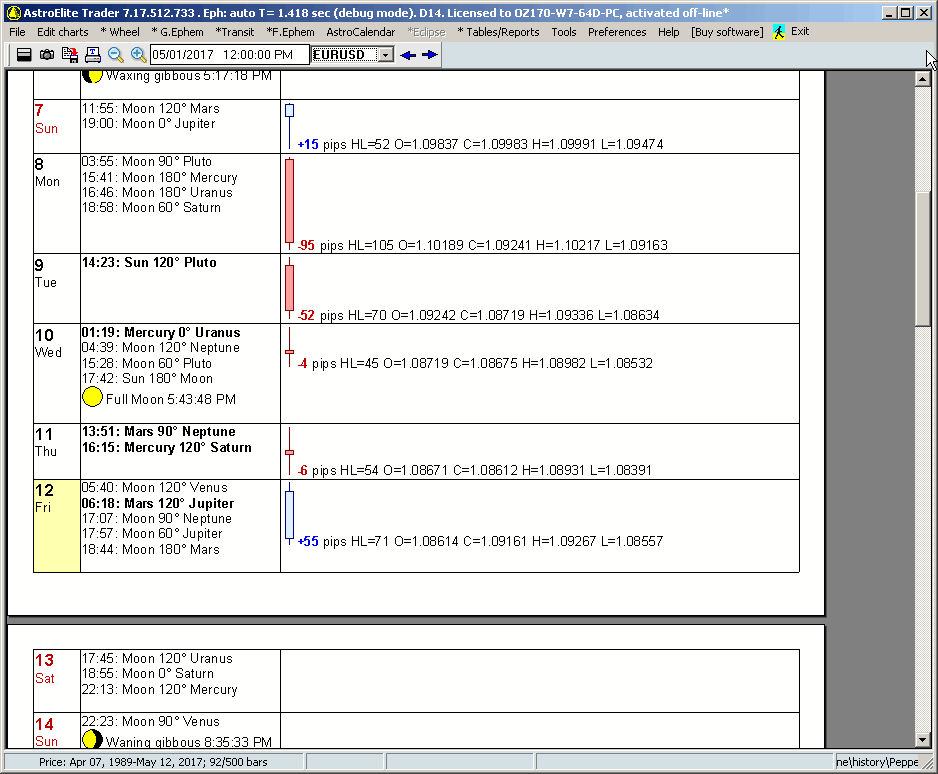
    This screenshot been made from 2560 x 1440 display with 125% font size.


+ Reply to Thread

Bookmarks

Posting Permissions

  • You may not post new threads
  • You may not post replies
  • You may not post attachments
  • You may not edit your posts