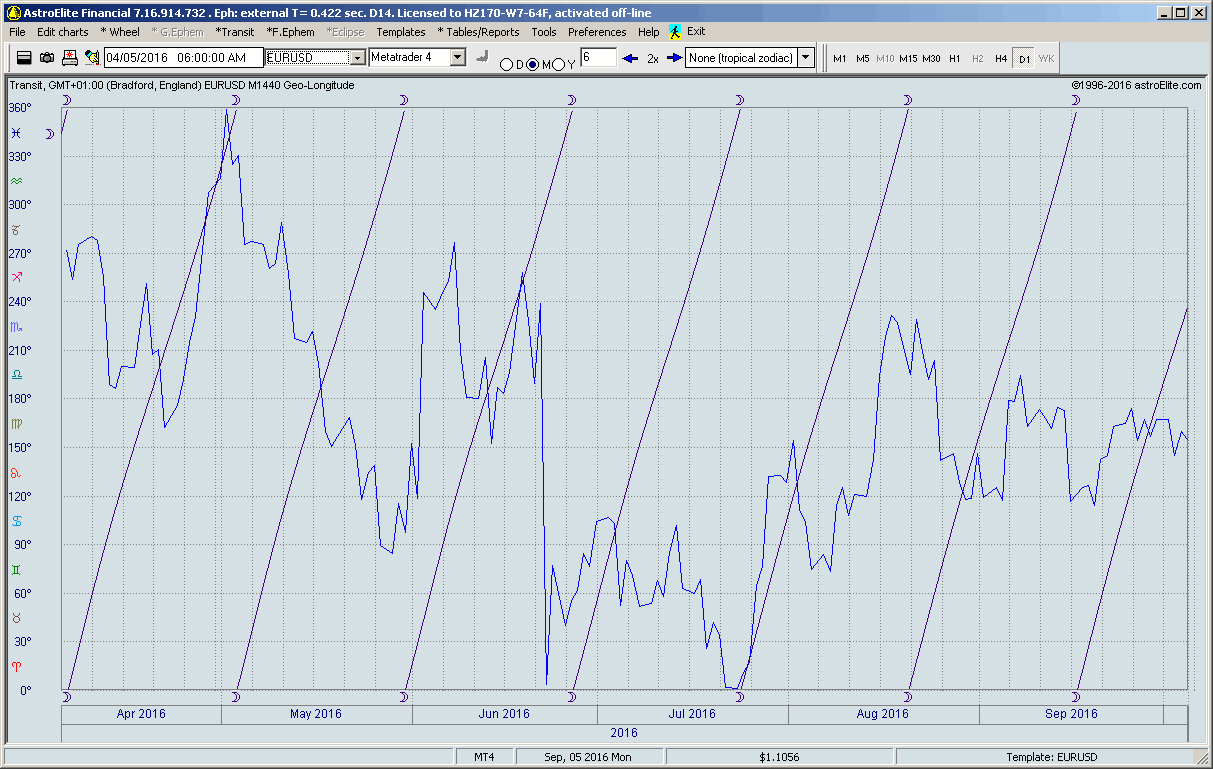
If I understood you correctly, a Bradley graph is the same no matter what its screen start date is.Originally Posted by Abdulrahman
To make things clear, set invisible all other graphs like price and planetary lines and then click toolbar Forward/Backward blue buttons with arrows and compare the graphs.
That's what I've got:
What do you see in the case?


 Reply With Quote


Bookmarks