+ Reply to Thread
Results 1 to 3 of 3

Thread: Abdulrahman

Hybrid View

  1. #1
    Administrator
    Join Date
    May 2010
    Posts
    149
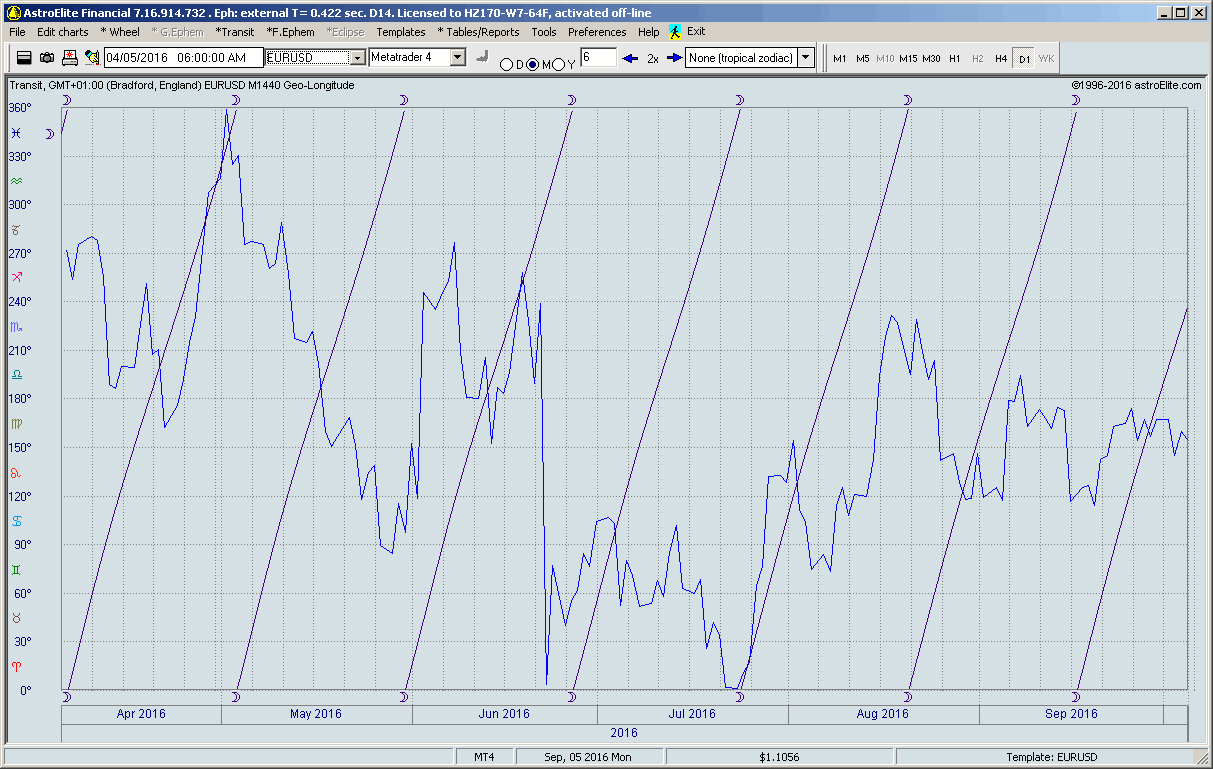
    please let me know how I display the price movement with Bradley Index only i.e. as in the attached photo taken from your website.
    • Uncheck Transit box to turn off planetary lines
    • Change Y axis labels from Degrees to Prices


    Both controls are marked with red on the attached screenshot

  2. #2
    Administrator
    Join Date
    May 2010
    Posts
    149
    noted that when converting the vertical axis into degrees, the reaching of price line to the degree (0) was followed by a swing high and if it reaches the degree (360), this is followed by swing down.
    My conclusion, hopefully accurate, that there should be a sort of equation to convert price into degrees and vice versa.
    Am I right?
    No, you are not.
    There is no any conversion of price to longitude or vice versa. Just two graphs scaled to fit a same grid.
    Price line reaches not a degree 0°, but a minimum value for given date range. This minimum is got from historical data from start date to end date.
    That's why after reaching minimum, price graph always goes higher.

    Planets usually orbit by circles, that's why their coordinates appear as sloping lines and after 360° they move to zero degree.


+ Reply to Thread

Bookmarks

Posting Permissions

  • You may not post new threads
  • You may not post replies
  • You may not post attachments
  • You may not edit your posts